The Urban Heat Island
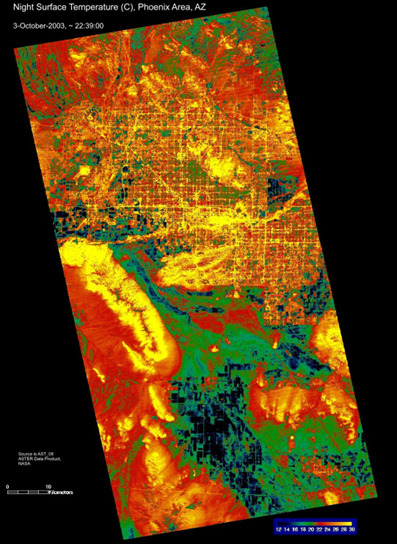
Urban structures change how energy is used and stored in cities, making the center of the city warmer at night than the rural areas that surround the city. The “island” of warmer nighttime temperatures in the city center is identified as the urban heat island.
Asphalt, concrete, and cement (like in roads and buildings) store sunlight during the day and release the heat slowly at night. Buildings and roads cool off very slowly at night, which means that air temperatures in the city cool off very slowly at night. Daytime (maximum) air temperatures are usually not as impacted by this process, but nighttime (minimum) air temperatures increase as urbanization increases.
The urban heat island magnitide is calculated as the urban air temperature minus the rural air temperature (Urban – Rural). Phoenix has one of the largest urban heat island magnitudes in the world, with up to a 10°-14°F temperature difference between Phoenix Sky Harbor Airport and Wickenburg, Queen Creek, Casa Grande, or Maricopa.
The urban heat island is usually at its largest magnitude during calm, dry, summer nights.
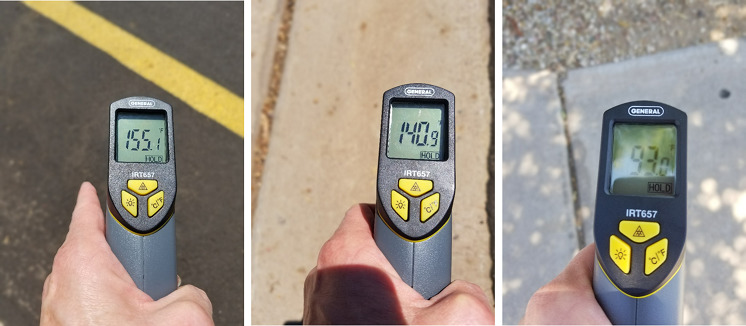
Mesa, AZ |September| The air temperature was 105° at 3PM. At roughly the same time, the asphalt temperature was 155°F, concrete in sun was 140°F, and concrete in shade was 93°F. All observations were taken within 5 minutes and within 10 feet of each other.
Statewide Monthly Minimum Temperature
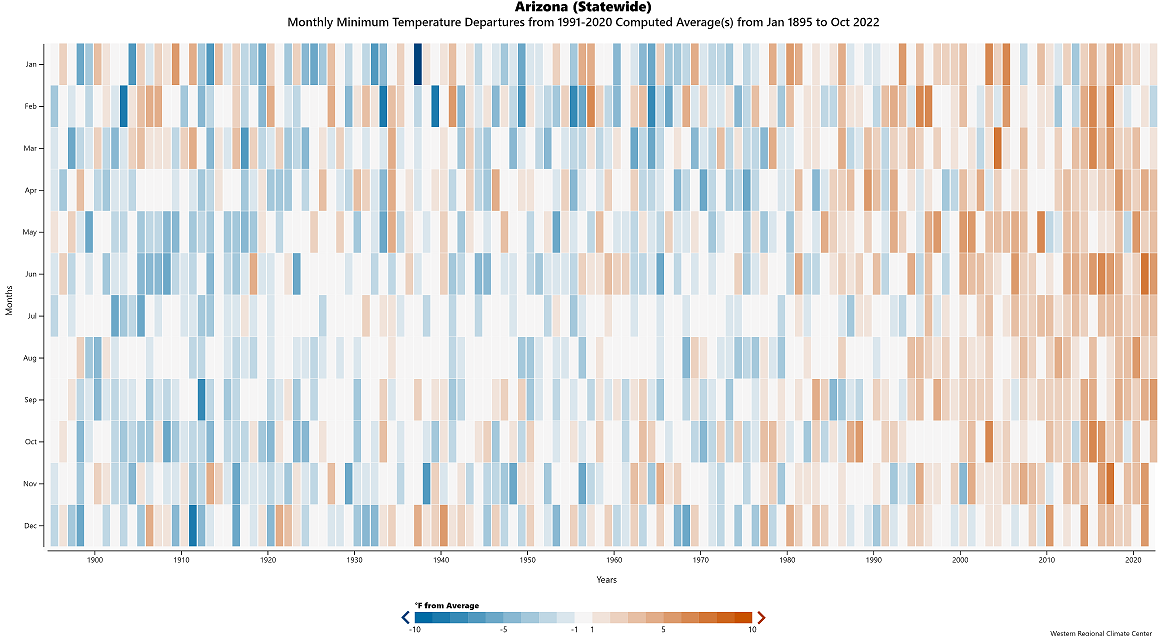
Statewide monthly minimum temperatures have been increasing through time. This chart shows that temperatures at night are not cooling off as much as they did in previous years, largely as a result of the urban heat island effect in cities and towns.
Statewide Monthly Maximum Temperature
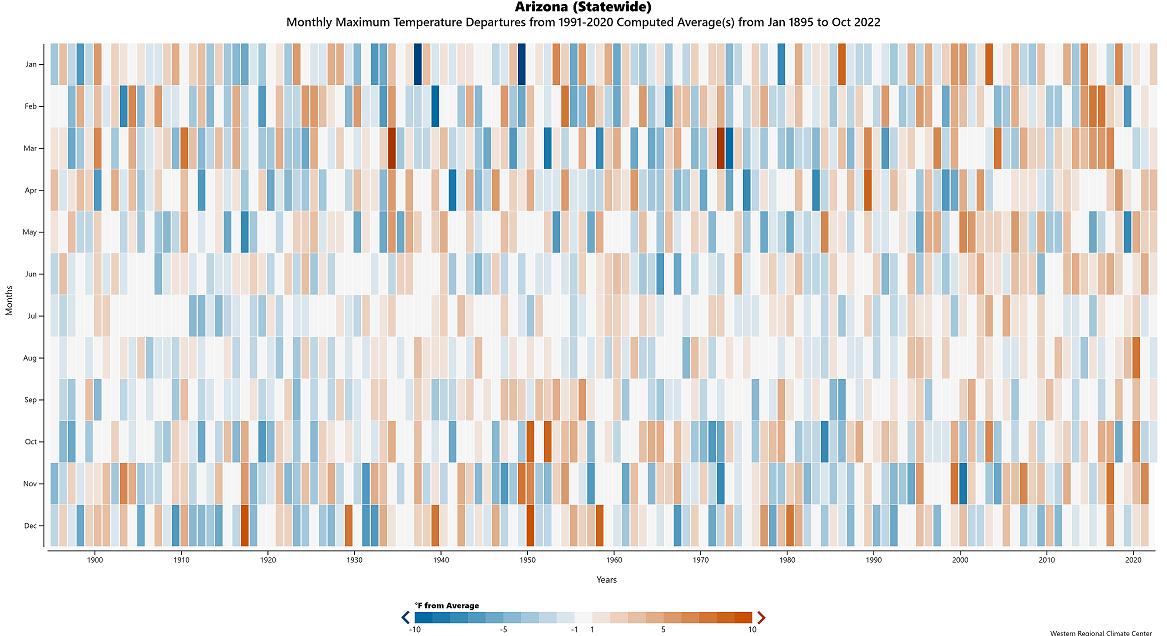
Statewide monthly maximum temperatures have shown a few more months where maximum temperatures have been warmer than average.
Statewide Monthly Mean Temperature
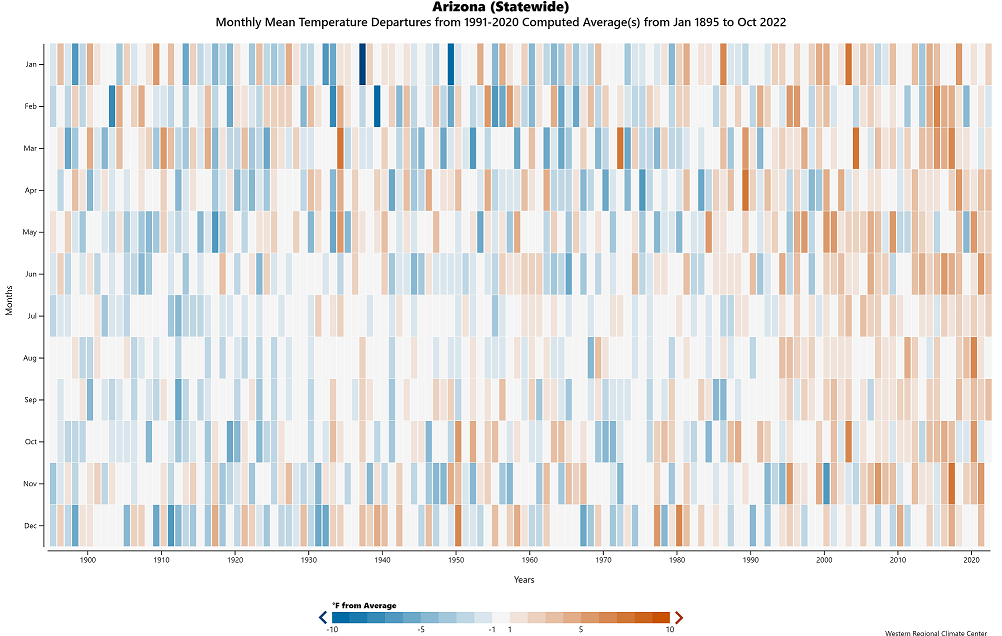
Statewide monthly mean temperatures are calculated as the average of maximum and minimum temperatures. This chart shows the influence of the urban heat island on the monthly mean temperatures.